data storytelling / self-initiated
2018
Hipsters vs Starbucks
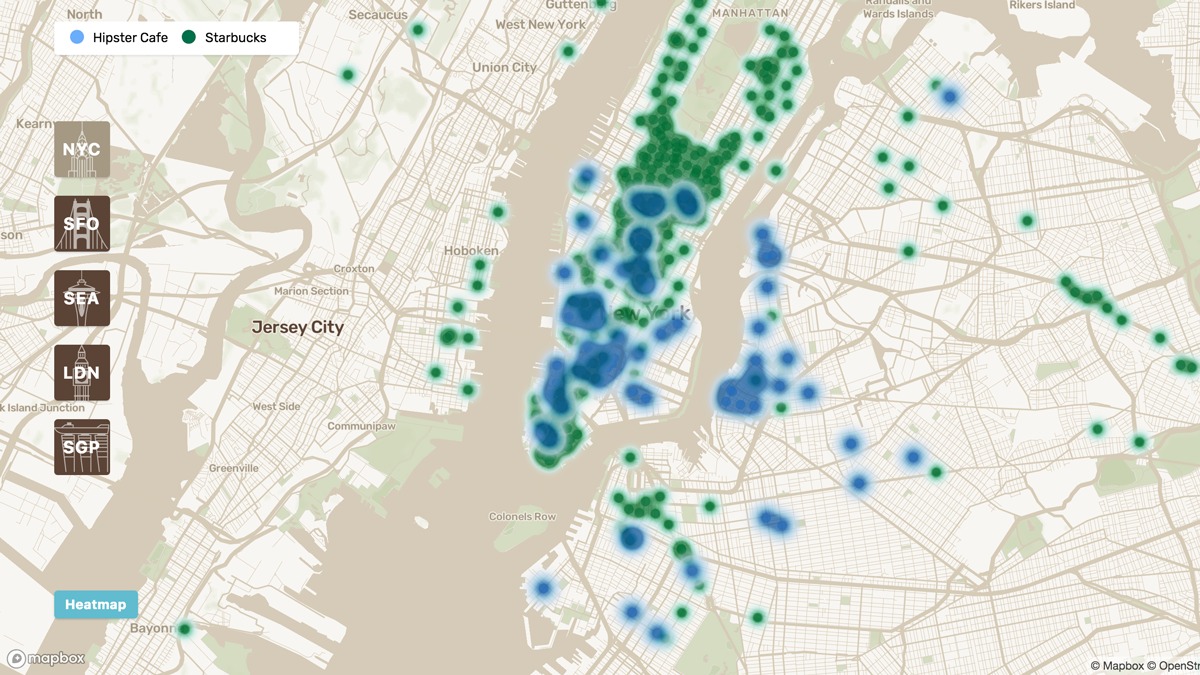
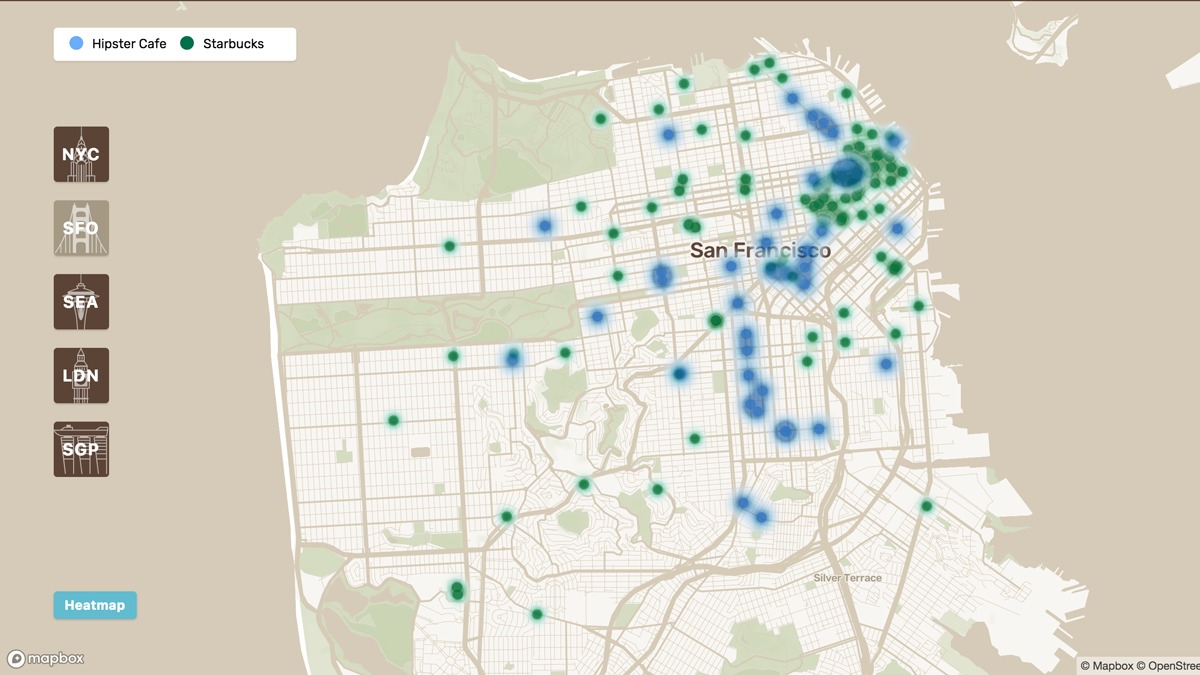
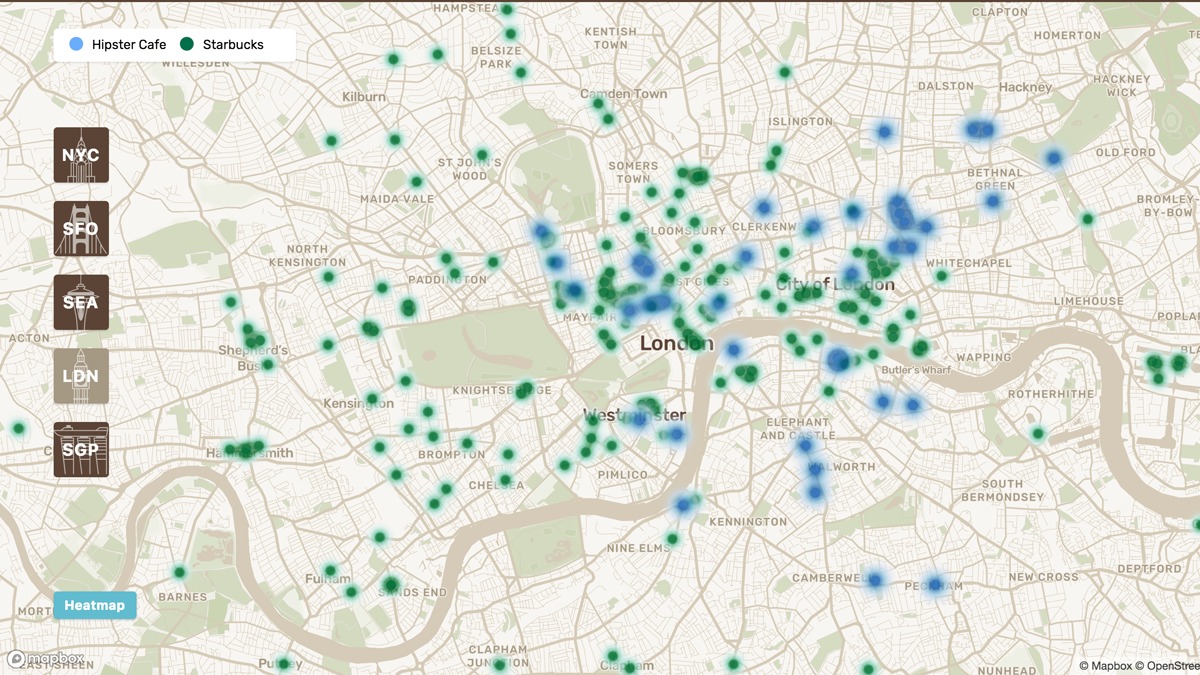
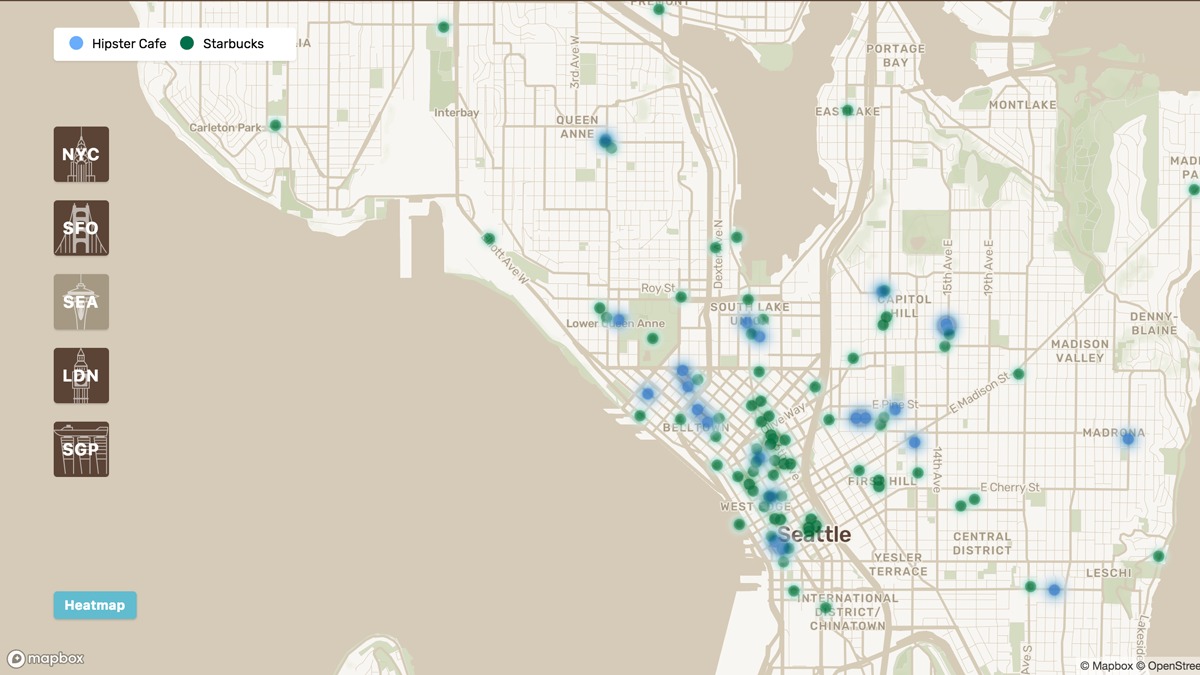
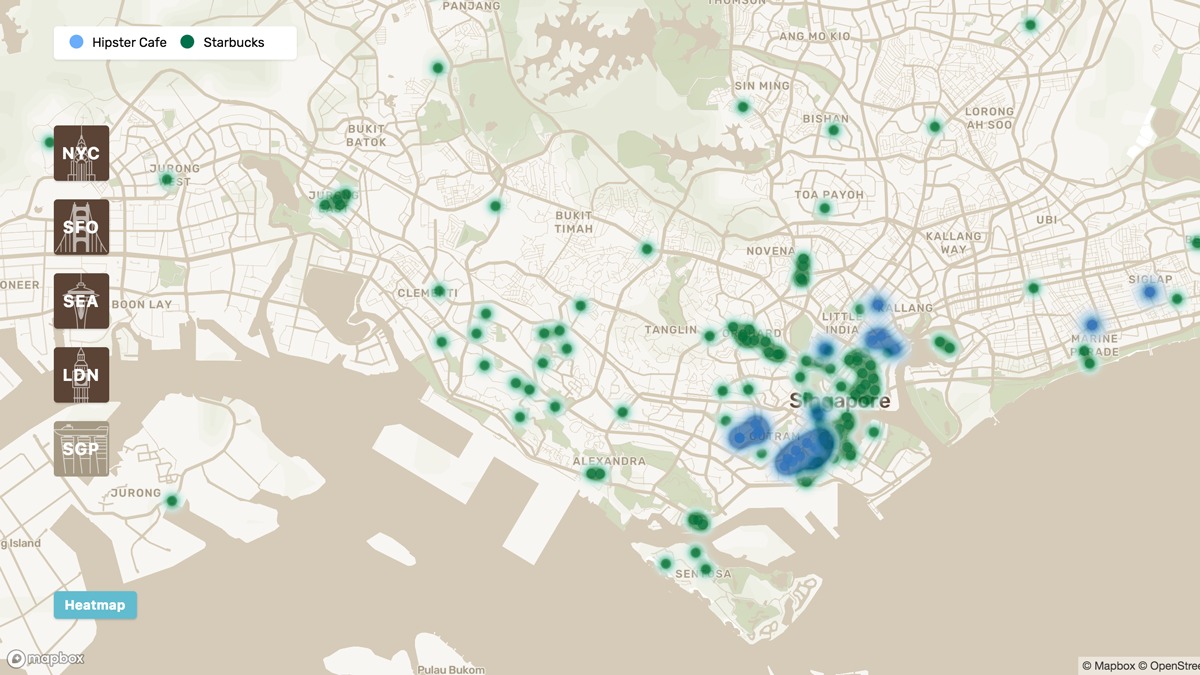
The project mapped Starbucks locations and compared them to cafe locations where the keyword ‘hipster’ appeared in Foursquare reviews in 5 cities (New York, San Francisco, Seattle, London and Singapore). This idea came from the observation that Starbucks are usually not located in ‘hipster’ neighbourhoods.
But what makes a cafe a hipster location? We accessed reviews from Foursquare API and got the geo-locations of the cafes. The heatmaps show that cafes that are rated hip tend to be off the mainstream locations where Starbucks coffeeshops are settled.
Our outcome shows the power of visualisation of geo-referenced data without a larger explanation of statistical details. The visitors can make their own image and interpretation of the dataset.
I worked on concept development, frontend coding using HTML/CSS, Javascript and Mapbox API, graphic and UI.
Try and explore it here!
team
Shiho Asada | Concept, design, frontend development
Dr Johannes Mueller | Data extraction, frontend development
data
Foursquare API
Starbucks locations
story
Do cafes make the neighbourhood ‘hipster‘?
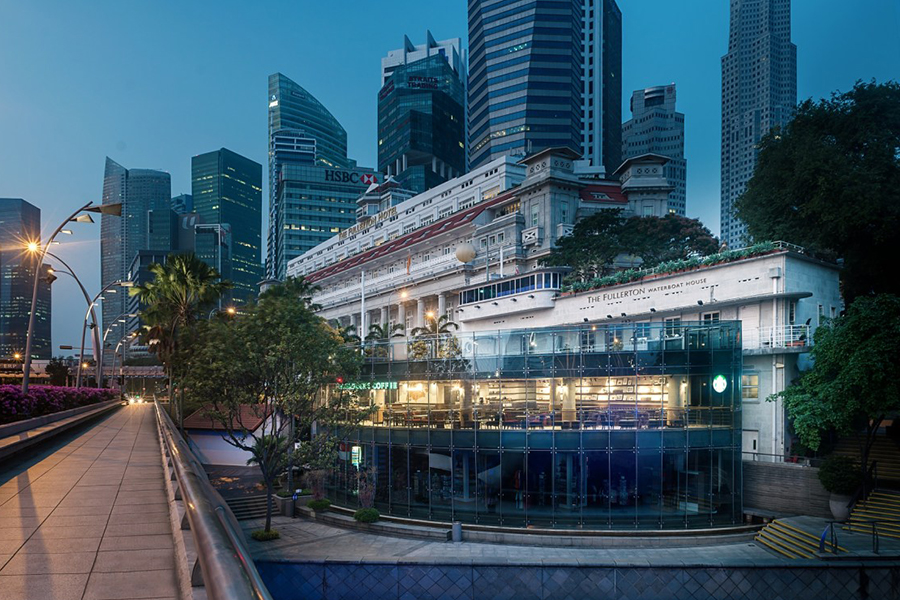
When I moved to Singapore from Tokyo, I realised Starbucks is everywhere. But one day, I walked around Tiong Bahru, which is famous as a ‘hipster neighbourhood‘, I only found unique cafes, but no Starbucks. I like the hood and wanted to know similar neighbourhoods where some unique cafes/shops locate.
Then I came up with the idea to visualise the locations of hipster cafes and Starbucks and see the correlation between them.
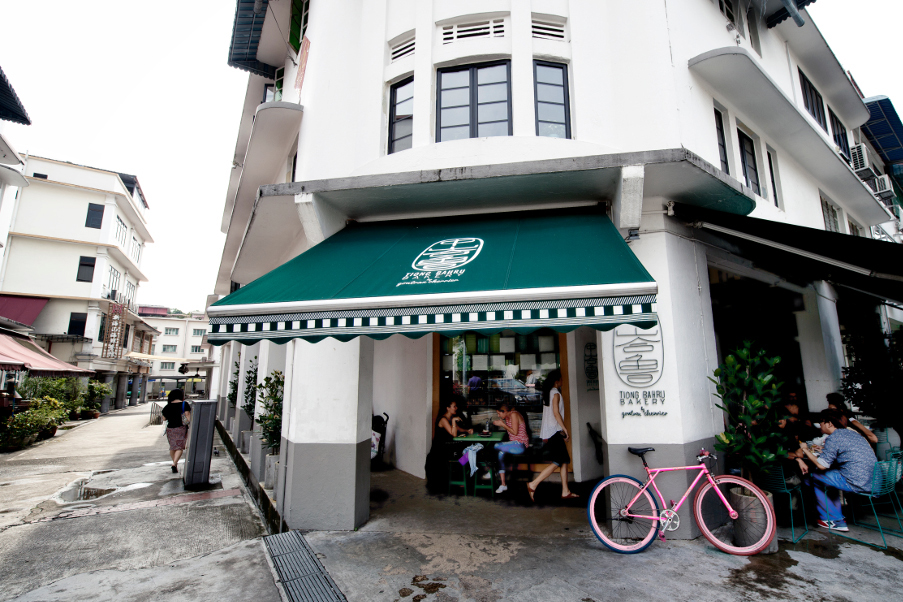
Top: Tiong Bahru Bakery, Tiong Bahru
Bottom: Starbucks at Fullerton Waterboat House, CBD
visualisATION
Results in 5 cities
graphic
Icons
Looking to collaborate? Talk to me.
© 2021 Shiho Asada
